Risks of bias and quality assessment
Study limitations and biases (per Cochrane and GRADE criteria) are summarized in [Table 2]. Randomization was performed using random number generation in all trials.None of the trials tested AF ablation against a sham procedure and thus patients and their treating physicians were not blinded.This creates performance and outcomes assessment bias. Therefore, our confidence in the outcome assessment is moderate. Assessment ofLVEF was blinded in four trials.[2,3,5,6]
All studies appropriately described crossovers and dropouts. Crossover occurred in two patients in the study by Jones et. al.[3] and in 46 patients in the CASTLE AF trial. [8] Loss to follow-up was most prevalent in the CASTLE AF trial (33 [9.1%] patients).Further details on interventions and follow up are provided in [Table 3].
Evaluation of the funnel plots revealed no evidence of publication bias.
Table 2. Risk of bias assessment
| Bias |
Study |
Judgement |
Support for judgement |
| Random sequence generation (selection bias) |
|
|
|
|
MacDonald 2011 |
Low risk |
Computer generated |
|
Jones 2013 |
Low risk |
Computer generated |
|
Hunter 2014 |
Low risk |
Random number generator |
|
Di Biase 2016 |
Low risk |
Computer generated |
|
Prabhu 2017 |
Low risk |
Computer generated |
|
Marrouche 2018 |
Low risk |
Computer generated |
| Allocation concealment (selection bias) |
|
|
|
|
MacDonald 2011 |
Low risk |
Computer generated randomization |
|
Jones 2013 |
Low risk |
Computer generated randomization |
|
Hunter 2014 |
Low risk |
Random number generator |
|
Di Biase 2016 |
Low risk |
Computer generated randomization |
|
Prabhu 2017 |
Low risk |
Computer generated randomization |
|
Marrouche 2018 |
Low risk |
Computer generated randomization |
| Blinding of participants and personnel (performance bias) |
|
|
|
|
MacDonald 2011 |
High risk |
No blinding |
|
Jones 2013 |
High risk |
No blinding |
|
Hunter 2014 |
High risk |
No blinding |
|
Di Biase 2016 |
High risk |
No blinding |
|
Prabhu 2017 |
High risk |
No blinding |
|
Marrouche 2018 |
High risk |
No blinding |
| Blinding of outcome assessment (detection bias) |
|
|
|
|
MacDonald 2011 |
Moderate risk |
Only scans analysis was blinded |
|
Jones 2013 |
Low risk |
People conducting cardiopulmonary exercise test and imaging analysis were blinded |
|
Hunter 2014 |
Moderate risk |
Only echocardiogram analysis was blinded |
|
Di Biase 2016 |
Moderate risk |
Only echocardiogram analysis was blinded |
|
Prabhu 2017 |
High risk |
No blinding |
|
Marrouche 2018 |
High risk |
No blinding |
| Incomplete outcome data addressed (attrition bias) |
|
|
|
|
MacDonald 2011 |
Low risk |
No significant attrition |
|
Jones 2013 |
Low risk |
No significant attrition |
|
Hunter 2014 |
Low risk |
No significant attrition |
|
Di Biase 2016 |
Low risk |
No significant attrition |
|
Prabhu 2017 |
Low risk |
No significant attrition |
|
Marrouche 2018 |
Low risk |
No significant attrition |
| Selective reporting (reporting bias) |
|
|
|
|
MacDonald 2011 |
Low risk |
|
|
Jones 2013 |
Low risk |
|
|
Hunter 2014 |
Low risk |
|
|
Di Biase 2016 |
Low risk |
|
|
Prabhu 2017 |
Low risk |
|
|
Marrouche 2018 |
Low risk |
|
Table 3. Intervention and follow-up
|
MacDonald |
Jones |
Hunter |
Di Biase |
Prabhu |
Marrouche |
| Ablation strategy |
PVI ± Linear lesions and sources of complex fractionated electrograms ± Cardioversion ± cavotricuspid isthmus ablation |
PVI ± Linear lesions ± left atrial complex fractionated electrograms ± Cardioversion ± cavotricuspid isthmus ablation. |
PVI with ablation of complex or fractionated electrograms ± Linear lesions ± Cavotricuspid isthmus ablation |
PVI, and left atrial posterior wall isolation ± SVC isolation ± Linear lesions ± left atrial complex fractionated electrograms ± cardioversion |
PVI, left posterior wall isolation ± cardioversion |
PVI, Additional ablation lesions were made at the discretion of the operators |
| Frequency of monitoring (months) |
3 and 6 |
3,6 and 12 |
1, 3 and 6 |
3, 6, 12 and 24 |
3 and 6 |
3, 6, 12, 24, 36, 48 and 60 |
| Method of assessing rhythm on follow up |
24h Holter monitor |
48h Holter monitor ± existing implantable devices |
48h Holter monitor |
ECG, and existing implantable devices |
24h Holter monitor and ILR |
Existing implantable devices |
| Repeat ablation |
6 (28.6%) |
5 (19.2%) |
14 (53.8%) |
1.4 ± 0.6 per person |
Repeat procedure was allowed (frequency not given) |
37 (24.5%) |
| Crossover |
None |
2 |
None |
None |
None |
46 |
| Loss to follow up |
3 |
None |
1 |
None |
1 |
33 |
| AAD on follow up |
Oral amiodarone for 3 months in all patients post ablation. |
AAD stopped post ablation unless indicated by other reasons |
AAD stopped post ablation unless indicated by other reasons |
AAD allowed for 3 months after the first ablation |
12 patients post ablation |
48 patients in the ablation arm and 64 in the control arm. |
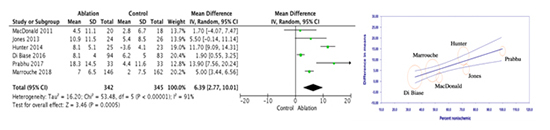
LVEF: Data for difference in change in LVEF was available from all six trials. Compared to medical therapy alone, AF catheter ablation was associated with a significant increase in LVEF (mean difference 6.4%; 95% CI: 2.8 – 10.0; P<0.001), [Figure 2].In a sensitivity analysis when including only trials that had a blinded assessment of LVEF, AF catheter ablation was not associated with a statistically significant increase in LVEF (mean difference 5.3%; 95% CI: -0.6 – 11.2; P=0.08). The heterogeneity test was significant (Tau²= 16.2; df= 5; P< 0.001, I²= 91%), and it did not improve on sensitivity analysis.
When baseline LVEF of the placebo group was used as the moderator variable, we observed no significant change in heterogeneity (Tau²= 15.9; df= 4; P< 0.001, I²= 91.1%, R2= 0.02). However, when percentage of patients with non-ischemic cardiomyopathy in the placebo group was used as the moderator variable,heterogeneity dropped significantly and a strong linear relationship was observed such that as the percentage of patients with non-ischemic cardiomyopathy increased in the trials, the difference in change in LVEF was greater with ablation (Tau²= 1.5; df= 4, I²= 44.7%; P= 0.12, R2: 0.91), [Figure 2]. This means that most of the variation observed in the treatment effect of the difference in change in LVEF between the ablation and control groups from the original meta-analysis could be explained by the percentage of patients in the trials who had non-ischemic cardiomyopathy.
Figure 2. Change in LVEF, meta-analysis (left) and meta-regression (right) results.
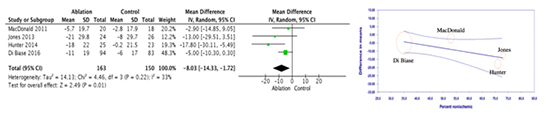
Quality of life based on MLWHFQ scores:Four trials reported data on MLWHFQ.There was a significant improvement in the MLWHFQ scores in the AF catheter ablation group when compared to the medical therapy group (mean difference -8.0; 95% CI: -14.3 – -1.7; P= 0.01), [Figure 3]. There was moderate heterogeneity (Tau²= 14.1, df= 3; P= 0.22, I² = 33%).
Baseline LVEF was not related to the observed treatment effects (Tau²= 35.6; df= 2; P= 0.11, I²= 54.4%, R2= 0.00). On the other hand, when the percentage of patients with non-ischemic cardiomyopathy was used as the moderator variable, heterogeneity dropped to zero and a strong linear relationship was observed such that as the percentage of patients with non-ischemic cardiomyopathy increased in the trials, improvement in MLWHFQ scores was greater with ablation (Tau²= 0.0; df= 2; P= 0.41, I²= 0.0%, R2= 1.00), [Figure 3]. This means that nearly all of the variation observed in the treatment effect of mean difference in change in MLWHFQ scores between the ablation and control groups from the original meta-analysis could be explained by the percentage of patients in the trials who had non-ischemic cardiomyopathy.
Figure 3. Change in MLWHFQ, meta-analysis (left) and meta-regression (right) results.
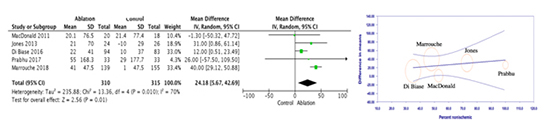
6-minute walk distance in meters:Data on6-minute walk distancewere reported in five trials. The mean increase in 6-minute walk distance was higher in the AF catheter ablation group compared to the medical therapy group (mean difference 24.2; 95% CI: 5.7 – 42.7; P= 0.01), [Figure 4].Heterogeneity was significant (Tau²= 235.9; df= 4, P= 0.01, I²= 70%). On sensitivity analysis, most of the heterogeneity was driven by the AATAC and CASTLE AF trials [6,8], and when excluded from the analysis, the heterogeneity became low (I2: 0.0%) without significant change in the point estimate, P< 0.05).
Controlling for baseline LVEF didn't result in significant change in heterogeneity (Tau²= 289.0; df= 3; P= 0.005, I²= 77.0%, R2= 0.00). Similarly, we didn't observe significant change in heterogeneity when the percentage of patients with non-ischemic cardiomyopathy was used as the moderator variable(Tau²= 228.2; df= 3; P = 0.03, I²= 67.4%, R2= 0.00), [Figure 4]. This means that the variation observed in the treatment effect of mean difference in change in 6-minute walk distances between the ablation and control groups from the original meta-analysis could not be explained by the percentage of patients in the trials who had non-ischemic cardiomyopathy.
Figure 4. Change in 6MWT, meta-analysis (left) and meta-regression (right) results.
Cardiovascular mortality, heart failure hospitalizations, and stroke:With the exception of the AATAC [6] and CASTLE AF trials,[8] the remaining trials were not designed nor powered to detect a difference in cardiovascular mortality orHF hospitalizations.
Unplanned hospitalizations and death were significantly higher in the amiodarone arm in the AATAC trial6 (58 [57%] vs. 32 [31%]; P < 0.001) and (18 [18%] vs. 8 [8%]; P= 0.037), respectively.
In the CASTLE AF trial,[8] cardiovascular mortality and HF hospitalizations weresignificantly higher in the medical treatment arm (41 [22.3%] vs. 20 [11.2%]; P= 0.008) and (66 [37.9%] vs. 37 [23.7%] P= 0.004), respectively. Stroke occurred at higher rates in the medical treatment arm, however, this didn't reach statistical significance (11 [6.0%] vs. 5 [2.8%]; P= 0.14).