Cryoballoon-to-Pulmonary Vein Occlusion Assessment via Capnography Technique: Where Does Occlusion Testing by End-Tidal CO2 Measurement “Fit” as a Predictor of Long-Term Efficacy?
Robert A Pickett1, Kimberly Owens1, Penny Landis1, Rahmani Sara2, Hae W Lim3
1St. Thomas Research Institute, Nashville, Tennessee.2Medtronic CryoCath, Pointe-Claire, Canada.3Medtronic, Inc., Minneapolis, Minnesota.
Parameters used to gauge the effectiveness of a cryoballoon lesion have been described that monitor the ablation at the time of balloon-to-pulmonary vein (PV) occlusion, during the cryoablation freeze, and at the thaw phase of the cryoablation. This study examines the balloon-to-PV occlusion step and monitors the completeness of occlusion using capnography to measure end-tidal CO2 (ETCO2). Specifically, the main objective was to determine if ETCO2 measurements can be used to quantify the amount of balloon-to-PV occlusion and to determine if acute ETCO2 parameters could predict long-term freedom from atrial fibrillation (AF).
In a prospective study, 30 subjects were cryoballoon ablated for drug refractory symptomatic paroxysmal AF by pulmonary vein isolation method. During the balloon-to-PV occlusion and throughout the cryoablation, ETCO2 measurements were recorded. The subjects were followed for a 12-month period to monitor their freedom from AF. Five subjects had a recurrence of AF outside of a 90-day blanking period but before the 12-month endpoint. Between the 25 subjects that maintained normal sinus rhythm (NSR) and the 5 subjects that had recurrent AF (rAF), there were no statistical differences in procedural parameters, including: the number of cryoablations per PV, duration of each cryoablation, balloon nadir temperature, or balloon thaw time. Additionally, there were no statistical differences in baseline ETCO2 and in nadir ETCO2 between the two cohorts; however, when examining Δ ETCO2, the subjects in the NSR cohort had a significantly larger change compared to the rAF cohort (P<0.001). The largest change in ETCO2 during balloon-to-PV occlusion was observed during the cryoballoon ablation of the superior PVs; however, Δ ETCO2 did not solely predict long-term freedom from AF for the individual subject.
Δ ETCO2 did tend to be larger in the NSR cohort compared to the rAF cohort; however, ETCO2 monitoring was more responsive in the superior PVs and less useful in the inferior PVs. Moreover, ETCO2 monitoring could not be used as a sole indicator of long-term efficacy. Suggesting that monitoring balloon-to-PV occlusion is a necessary first in cryoballoon ablation, but other parameters must be incorporated and observed as surrogates of a circumferential and transmural lesion formation with long-term durability.
Key Words : Atrial Fibrillation, Capnography, Catheter Ablation, Cryoablation, Cryoballoon.
Correspondence to: Dr. Robert A Pickett
Saint Thomas Heart 301 21st Avenue North
Nashville TN
Pulmonary vein isolation (PVI) has become a cornerstone ablation strategy in the management of patients with atrial fibrillation (AF)[1]. Additionally, the cryoballoon (Arctic Front Advance; Medtronic, Inc.) has been proven to be safe and effective when treating patients by a PVI method during catheter ablation[1]. Several key parameters have been established for long-term durable efficacy when using the cryoballoon catheter, including:[2-5] 1) before ablation is initiated, pulmonary vein (PV)-to-balloon occlusion is critical; 2) during the early phase of the freeze, the acute time-to-isolation (TTI) of a PV is important; 3) during the latter phase of the freeze, the balloon nadir temperature can be useful when TTI is unavailable; and 4) lastly, after freeze termination, the thaw time of the cryoballoon can be informative with regards to long-term durable efficacy.
Thus far, assessment techniques for PV-to-balloon occlusion have included observational descriptions or semi-quantitative methodologies[6-9]. Specifically, balloon occlusion evaluation methods have included ultrasound imaging in Doppler mode, pressure monitoring at the balloon tip, and fluoroscopy imaging of radiopaque contrast agent retention at the distal nose of the balloon[1],[6-9]. Additionally, the usage of capnography and the resulting change in end-tidal CO2 (ETCO2) has been previously described[10]. In brief, during capnogram monitoring, the PV-to-balloon occlusion creates a ventilation-perfusion mis-match that can be assessed by the decline in exhaled ETCO2; however, long-term patient efficacy during follow-up has not be conducted with regard to the utility of ETCO2 as a marker of PV-to-balloon occlusion. Here, we examine a cohort of patients who had ETCO2 monitored during cryoballoon ablation and long-term efficacy evaluated during follow-up.
This study was a prospective single-center single-arm evaluation of 30 subjects who had a cryoballoon ablation for drug refractory symptomatic paroxysmal AF. Subjects were treated for an index ablation between June 2013 and June 2015. During the ablation, ETCO2 was monitored and used to evaluate PV-to-balloon occlusion. Subjects were monitored during long-term follow-up for the recurrence of AF. The inclusion criterion was a patient scheduled to undergo an index cryoablation procedure for the treatment of paroxysmal AF using only a PVI strategy for ablation. Exclusion criteria were subjects with a patient history of diabetes mellitus or dysautonomia, age younger than 18 years or older than 90 years of age, mentally unable to give informed consent or unfit for a clinical study, and/or unable to maintain the clinical follow-up schedules through office visits and/or cardiac device monitoring. The exclusion of subjects with a clinical history of diabetes mellitus and/or dysautonomia were predefined in the study protocol because these clinical conditions can alter the baseline hemodynamics and efficacy response to catheter ablation therapy. All patients gave informed consent prior to the ablation procedure, and the study was approved by the local hospital institutional review board of St. Thomas Hospital (Nashville, TN).
The procedural techniques of cryoballoon ablation have been previously described in detail[4]. In brief, subjects held anticoagulation therapy for 24 hours before the procedure. All subjects were administered general anesthesia (propofol). Femoral venous entry was used to deliver all sheaths and catheters. A decapolar and quadripolar diagnostic catheter was placed and used in the right atrium and coronary sinus during electrophysiology recordings and atrial conduction pacing. Intravenous heparin was delivered at the time of transseptal puncture, and activated clotting time was set at a target ≥ 300 sec. Subjects underwent a cryoballoon ablation using either a 23- or 28-mm Arctic Front Advance ablation catheter which was delivered using a dedicated steerable sheath (FlexCath; Medtronic, Inc.). Balloon occlusion and freezing of the PV was conducted using an over-the-wire delivery, and high-output right phrenic nerve pacing (10-25 mA at 1,000-1,200 msec) was conducted during all right-sided PV cryoablations. Immediate freeze termination was initiated at any sign of diminished or loss of pacing capture at the diaphragm. Uninterrupted freezes were continued for a minimum of 180 sec and a maximum of 240 sec. Ablation attempts that did not achieve a balloon temperature of -40oC with 60 secs of freezing were terminated, and subsequently, the cryoballoon was repositioned for better PV occlusion. A freeze-thaw-refreeze strategy of ablation was used requiring at least two ablation attempts at each PV. Entrance and exit block testing using diagnostic catheters was conducted after a 30-minute waiting period to confirm PVI.
The ETCO2 reporting from capnography has been described, and the procedural techniques used in this study were similar to a previous description[10]. Briefly, side-stream sampling was used with the shortest possible length of tubing so that there was minimal delay between sampling and reporting of exhaled ETCO2. The concentration of exhaled CO2 gas was monitored at baseline (before a PV freeze), and subsequently, it was recorded at recurrent 30 sec intervals during the cryoablation. In quick review, ETCO2 is an indicator of pulmonary blood flow which is sensitive to changes in cardiac output and/or ventilation/perfusion[10]. However, when the patient is at steady-state equilibrium during the cryoballoon ablation, the ETCO2 recording is also sensitive to the PV-to-balloon occlusion. Specifically, the balloon occlusion creates a temporary circulating pulmonary blood flow deficit, and consequently, the concentration of exhaled CO2 is reduced in response to the PV-to-balloon occlusion.
Study Design and Follow-up
The primary efficacy endpoint of the study was to determine the 1-year outcome of the cryoballoon ablation procedure in a cohort of patients who had PV-to-balloon occlusions guided and monitored with ETCO2 recordings from capnography during the cryoballoon ablation procedure. The secondary endpoint of the study was to determine if any of the ETCO2 recording(s) could be used to differentiate between the subjects who had recurrent AF (rAF) during follow-up and those subjects that maintained normal sinus rhythm (NSR). All subjects wore a 48-hour Holter monitor at baseline and at the end of a “landmark” 90-day blanking period. During the 90-day blanking period, recurrence of atrial arrhythmia events were allowable without penalty to the long-term efficacy endpoint to allow for cardiac healing and lesion scar formation. Complaints of palpitations led to the usage of longer periods of cardiac monitoring (7-day Holter). Subjects were followed-up for 12 months in this study with scheduled office visits at 3, 6, 9, and 12 months after the index ablation. Office visits included a review of rhythm status using ECG examination, cardiac device interrogation, review of Holter monitors, and/or evaluation of continuous loop recorders. No blinding was used in this trial.
The change in ETCO2 (denoted Δ ETCO2) was calculated by subtracting the nadir ETCO2 (measured during each cryoablation) from the baseline measurement of ETCO2 at each PV (measured before each cryoablation). All discrete data are expressed as a count and percentage of the test cohort, and all continuous data are presented as a mean ± standard deviation. A test for normal data distribution was conducted for all continuous variables. Parametric continuous variables were tested using a t-test. A Mann-Whitney U test was used for nonparametric continuous variables. Discrete variables were tested using a Fisher’s exact or Chi-square test depending on sample size. The freedom from AF calculation included a landmark 90-day blanking period in which atrial arrhythmia events were not counted as long-term efficacy failures. One-way ANOVA testing was used to test for statistical differences amongst mean values in comparisons with more than two cohorts. Statistical data analyses were conducted using SAS (version 9.4) and Minitab 17 software. Statistical significance was accepted at a two-sided P < 0.05.
A total of 30 subjects were enrolled, treated, and monitored in this study from a pool of consecutive patients with drug refractory symptomatic paroxysmal AF (who agreed to be a part of the study and gave informed consent before the index cryoablation procedure). All patients were followed for one year after the index cryoballoon ablation by PVI method. During the 1-year follow-up, those patients who maintained sinus rhythm outside the 90-day blanking period were denoted as the NSR cohort while the rAF cohort had a recurrence of atrial arrhythmia outside the blanking period but within the 1-year follow-up period. Of the 30 subjects, 5 subjects had a recurrence of atrial arrhythmia (≥30 sec) before the 1-year follow-up period (83.3% freedom from atrial arrhythmia).
[Table 1] demonstrates the baseline clinical characteristics recorded before the index ablation. The total cohort was 77% male and had an average age of 66 years. Left atrial size was 4.1 cm (A/P) on average, and the mean left ventricular ejection fraction was 61%. In the total cohort, there was a 33% history of congestive heart failure, a 20% prevalence of coronary artery disease, and an 80% instance of hypertension. Interestingly, there were no statistical differences between the NSR and rAF cohorts regarding the recorded baseline clinical cardiovascular characteristics. Of note, the mean left atrial size of the rAF cohort was large (4.9 ± 0.7 cm) but not statistically different from the NSR cohort (4.0 ± 0.7 cm; P=0.176).
Table 1. Baseline patient characteristics. Continuous variables given as mean and standard deviation, and discrete variables given as count and percentage.
| Baseline Characteristic |
Total Cohort (N=30) |
NSR Cohort (N=25) |
rAF Cohort (N=5) |
P-value* |
| Gender (% male) |
23/30 (76.7%) |
20/25 (80.0%) |
3/5 (60.0%) |
0.565 |
| >Age (years) |
65.7 ± 6.6 |
65.3 ± 7.1 |
67.4 ± 3.0 |
0.301 |
| Left atrial size (cm) |
24.1 ± 0.7 |
4.0 ± 0.7 |
4.9 ± 0.7 |
0.176 |
| Left ventricular ejection fraction (%) |
61.3 ± 10.9 |
61.2 ± 11.2 |
62.0 ± 9.9 |
0.894 |
| History of: -Congestive heart failure |
10/30 (33.3%) |
8/25 (32.0%) |
2/5 (40.0%) |
0.999 |
| -Coronary artery disease |
6/30 (20.0%) |
5/25 (20.0%) |
1/5 (20.0%) |
1.000 |
| -Hypertension |
24/30 (80.0%) |
20/25 (80.0%) |
4/5 (80.0%) |
1.000 |
* Statistical test of significant difference between subjects in the normal sinus rhythm (NSR) cohort versus those subjects with recurrent atrial fibrillation (rAF) during the 1-year study follow-up period.
[Table 2] compares the NSR and rAF cohorts with regard to the intraprocedural parameters recorded during the cryoballoon cases. A similar percentage of the 28-mm balloons (compared to the 23-mm cryoballoons) were utilized in the NSR group compared to the rAF group with a preferential higher usage of the 28-mm cryoballoon in both cohorts. The mean number of ablations per PV were not statistically different with 2.2 ablations in the NSR group and 2.6 cryoablations in the rAF group (P=0.178). In total, there were 262 total cryoballoon lesions that were monitored during this study for intraprocedural parameters. The mean duration of each freeze was approximately 3 minutes with a mean balloon nadir temperature being achieved in 161 secs in both NSR and rAF groups. Freeze temperature at 30 sec and nadir freeze temperatures were not statistically different between the two cohorts, and thaw time from final freeze termination until +20 oC exceeded 30 sec duration in both groups (as recorded by the internal cryoballoon thermocouple). Consequently, the total amount of freeze delivery in both groups (NSR versus rAF) were similar when examining the total area under the freeze curve (oC x sec).
Table 2. Comparison of acute procedural freeze parameters between subjects with normal sinus rhythm (NSR) versus subjects with recurrent atrial fibrillation (rAF).
| Procedural measurement |
NSR (N=25) |
rAF (N=5) |
P-value |
| Usage of 28-mm balloon |
22/25 (88.0%) |
4/5 (80.0%) |
0.999 |
| Number of cryoablations per PV |
2.2 ± 0.6 |
2.6 ± 1.0 |
0.178 |
| Duration of each cryoablation (sec) |
172 ± 26 |
174 ± 43 |
0.788 |
| Balloon temperature at 30 sec (oC) |
-38.5 ± 10.3 |
-34.6 ± 5.5 |
0.053 |
| Time to balloon nadir temperature (sec) |
161.0 ± 31.6 |
160.7 ± 42.3 |
0.974 |
| Balloon nadir freeze temperature (oC) |
-48.6± 7.1 |
-48.4 ± 11.4 |
0.898 |
| Balloon thaw time (sec)* |
34.3 ± 14.0 |
38.7 18.8 |
0.230 |
| Total freeze AUC (oC x sec) |
-77413 ± 20033 |
-75111 ± 22568 |
0.882 |
* Thaw time measured from freeze termination until a +20 oC temperature is recorded by the cryoballoon internal thermocouple.
[Table 3] compares the ETCO2 recordings between the NSR and rAF cohorts. The mean baseline recording of ETCO2 was 41 mmHg in both cohorts. Additionally, when examining the nadir ETCO2 measurement there was no statistical difference between the NSR and rAF cohorts (P=0.061). However, the Δ ETCO2 measurement did show a significant difference between the NSR and rAF cohorts (P <0.001). Specifically, the NSR group had a larger change in ETCO2 (between baseline and nadir recording) compared to the rAF cohort. [Figure 1] graphs this difference in Δ ETCO2 in which the mean measurement for the NSR cohort is approximately 1.7X that found in the mean value of the rAF cohort.
Figure 1. The change in end tidal CO2 (ETCO2) from baseline to nadir reading (Δ ETCO2) by capnography was significantly larger in the subject cohort that maintained normal sinus rhythm (NSR; green bar) throughout the 1-year follow-up period compared to the group of subjects that had recurrent atrial fibrillation (rAF; red bar).
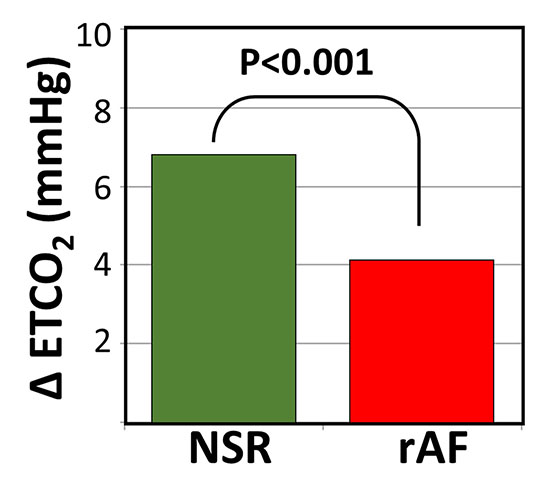
Table3. Comparison of end tidal CO2 (ETCO2) measurements between subjects with normal sinus rhythm (NSR) versus subjects with recurrent atrial fibrillation (rAF).
| Capnogram measurement |
NSR Mean ± STD |
rAF Mean ± STD |
P-value |
| Baseline ETCO2 (mmHg) |
41.3 ± 9.5 |
40.8 ± 5.9 |
0.661 |
| Nadir ETCO2 (mmHg) |
34.5 ± 9.6 |
36.7 ± 6.6 |
0.061 |
| Δ ETCO2 < 0.001* |
6.8 ± 5.0 |
4.1 ± 4.2 |
4.1 ± 4.2 |
* Statically significant difference
[Table 4] further evaluates the baseline and nadir ETCO2 recordings specific to each PV. The difference between the mean baseline and mean nadir measurement of ETCO2 was statistically different in all superior PVs (left superior (LSPV) and right superior (RSPV)) regardless of the subject’s rhythm cohort membership (NSR versus rAF). This change in ETCO2 over the duration of the cryoablation is depicted for the superior PVs in [Figure 2]. The left inferior PV (LIPV) did not have a statistical difference between mean ETCO2 value at baseline and nadir regardless of subject cohort designation (NSR versus rAF). Interestingly, the right inferior PV (RIPV) did show a significant difference between the mean baseline ETCO2 measurement and the mean nadir value when examining only those subjects that remained in sinus rhythm. [Figure 3]further examines the NSR, rAF, and total population cohorts utilizing box and whisker plots. In the NSR cohort, the nadir ETCO2 values tended to be lower, and the Δ ETCO2 values tended to be higher when compared to the rAF cohort in both comparisons. However, a definitive “cut-off” value (to distinguish the NSR and rAF cohorts) was not apparent for either nadir ETCO2 or Δ ETCO2 because of the large overlap in the first and third quartiles between groups (as represented by the range of the box in each cohort).
Figure 2. The change in ETCO2 over the duration of the cryoballoon ablation depicted for each pulmonary vein. The green-line graph denotes the cohort of subjects that maintained normal sinus rhythm (NSR) during the 1-year follow-up period, and the red-line graph represents the cohort of subjects that had recurrent atrial fibrillation (rAF).
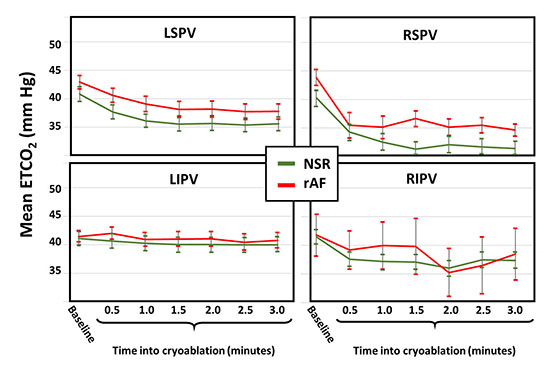
Figure 3. Box and whisker plot of subjects in three categories, including: the normal sinus rhythm (NSR) cohort in green, the recurrent atrial fibrillation (rAF) cohort in green, and the total population cohort in grey. Panel A depicts the nadir end tidal CO2 (ETCO2) reading between the three groups, and Panel B shows the change in ETCO2 (Δ ETCO2).
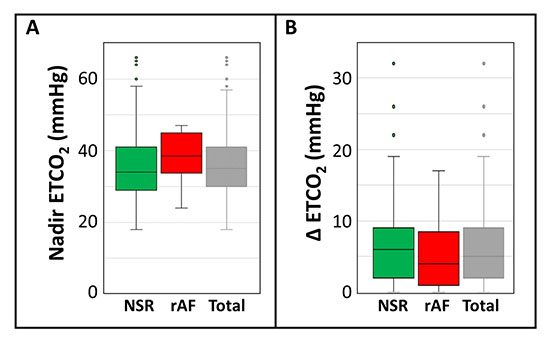
Table4. Comparison of end tidal CO2 (ETCO2) measurements at baseline and nadir recording when separated by each pulmonary vein (PV) and in accordance to subjects with normal sinus rhythm (NSR) versus subjects with recurrent atrial fibrillation (rAF).
| Pulmonary vein and Rhythm status |
Baseline ETCO2 (mmHg) |
Nadir ETCO2 (mmHg) |
P-value |
| Left Superior PV in NSR group |
40.8 ± 9.9 |
35.7 ± 9.5 |
0.004* |
| Left Superior PV in rAF group |
42.9 ± 4.6 |
38.2 ± 5.6 |
0.016* |
| Left Inferior PV in NSR group |
41.1 ± 9.8 |
40.1 ± 9.6 |
0.568 |
| Left Inferior PV in rAF group |
41.4 ± 3.4 |
41.1 ± 4.7 |
0.827 |
| Right Superior PV in NSR group |
40.3 ± 10.4 |
32.1 ± 10.4 |
< 0.001* |
| Right Superior PV in rAF group |
43.8 ± 3.5 |
35.2 ± 3.7 |
0.002* |
| Right Inferior PV in NSR group |
41.5 ± 9.5 |
36.0 ± 10.0 |
0.005* |
| Right Inferior PV in rAF group |
41.8 ± 8.1 |
35.3 ± 9.2 |
0.306 |
* Statically significant difference
Lastly, [Table 5] illustrates the surface area size for each PV at the orifice. There was no statistical difference in PV dimensions between the NSR and rAF cohorts when comparing the two groups by each individual PV category (LSPV, LIPV, RSPV, and RIPV) which ruled out the possibility of PV size having a confounding influence on balloon-to-PV occlusion. Also, in the total cohort, the right-sided PVs were (in general) larger in surface area at the PV orifice compared to the left-sided PVs regardless of rhythm status cohort designation (ANOVA P < 0.001). Consequently, PV orifice size was not a cause of maintenance (or non-maintenance) of sinus rhythm.
Table5. Comparison of pulmonary vein orifice surface area (cm2) between subjects with normal sinus rhythm (NSR) versus subjects with recurrent atrial fibrillation (rAF).
|
Pulmonary Vein Orifice |
Surface Area Mean ± STD (cm2) |
|
| Pulmonary vein (PV) |
NSR |
rAF |
P-value |
| Left Superior PV |
2.7 ± 0.7 |
12.9 ± 0.6 |
0.527 |
| Left Inferior PV |
2.7 ± 0.7 |
2.3 ± 0.9 |
0.516 |
| Right Superior PV |
3.7 ± 1.2 |
3.4 ± 0.6 |
0.540 |
| Right Inferior PV |
3.3 ± 0.9 |
2.9 ± 0.6 |
0.328 |
* Statically significant difference
To the best of our knowledge, this is the first study to examine the utility of capnography methods to gauge cryoballoon-to-PV occlusion and report on long-term outcomes. A previous study utilized the ETCO2 recording from the capnogram to examine acute intraprocedural changes during a cryoballoon catheter ablation[10]. In congruence with this current evaluation, both studies found that the superior PVs were more responsive to balloon-to-PV occlusion when examining ETCO2 (compared to the inferior PVs). The previous publication had postulated that the differential between the superior PVs and the inferior PVs may reflect the higher proportion of gas exchange at the upper lung lobes during general anesthesia (under volume control ventilation)[10]. Both studies agreed that ETCO2 evaluation of balloon-to-PV occlusion is somewhat limited for the inferior PVs. This current study determined that the cohort of subjects that maintained long-term NSR at 1-year had a larger Δ ETCO2 from baseline to nadir recording compared to the rAF cohort of subjects (when measuring the total capnogram recording at all PVs). However, other parameter of a cryoballoon ablation must also be utilized to assess the formation of a circumferential and transmural lesion. That is, the ETCO2 parameter only demonstrates quality balloon-to-PV occlusion, but other parameters must be used when the delivery of freeze begins. To assess freeze propagation into the left atrial tissue, other parameters have been established (e.g., acute time-to-PVI, rate of freeze, or nadir freeze temperature)[2-4], [11-12].
Baseline Patient Characteristics and Intraprocedural Parameters
In this current study, baseline patient cardiovascular characteristics were not different between the cohort of subjects that maintained NSR at 1-year versus those subjects that had rAF. There were no statistical differences between the NSR and rAF cohort with regard to several cardiovascular clinical characteristics. Additionally, the intraprocedural parameters were similar between both groups of subjects. These measurements included similar numbers of cryoapplications, durations of freezing, freeze nadir temperatures, and total freeze deliveries as measured by the area under the freeze curve (a measurement previously described by Aryana et al.)[11]. These data observations suggested that the difference(s) between the NSR and rAF cohorts were not a mere result of differential freeze protocols or baseline clinical patient characteristics.
Similarly, recordings of baseline and nadir ETCO2 were not different between the NSR and rAF cohorts. However, the Δ ETCO2 was significantly larger in the NSR cohort which was primarily driven by the differences observed at the superior PVs and to a lesser extent the RIPV. Reliable balloon-to-PV occlusion is the hallmark of the start of a robust cryoballoon ablation[4,12]. Hence, the traditional method is to examine the retrograde retention of radiopaque contrast agent under fluoroscopy imaging during balloon occlusion of the PV. The utilization of capnogram examination of ETCO2 seem to be a useful adjunctive parameter during occlusion with (perhaps) some benefit to gauging more durable PVI. Importantly, PV size was not a barrier to successful occlusion testing by ETCO2 recording in this study.
The current cryoballoon best practices encompasses three stages of procedural monitoring to further enhance the formation of a durable PVI[4] [12]. At the start of a cryoballoon ablation, it is critical to establish balloon-to-PV occlusion[12]. During the cryoablation, time-to-acute PVI and rates of freeze can be used to assess the progression of the freeze into cardiac tissue in an attempt to monitor/ensure both circumferential and transmural lesion formation[4,12]. Lastly, the duration of thaw can be informative regarding the potential success of the freeze application[12]. In general, freeze applications with a longer thawing period are associated with durable PVI[12]. In agreement with our current study, capnography can be used as an adjunctive tool to further assess balloon-to-PV occlusion; however, other monitoring methodologies must be used to further evaluate the freeze application to ensure that the ice formation has developed both a circumferential and transmural lesion. Monitoring Δ ETCO2 can be helpful to gauge balloon-to-PV contact, but other methods are needed to gauge the transmural ice formation (e.g., time-to-acute PVI).
In summary data set noted a drop in ETCO2 across all superior PVs regardless of the ultimate long-term rhythm status. Hence more information is needed to observe the circumferential and transmural freezing (and lesion formation) during cryoballoon ablation,Lastly, when ETCO2 did decrease the largest amount of change typically occurred in the first 60 to 90 secs from freeze initiation. Failures to achieve an ETCO2 decrease in 60 secs may be used with other parameters to terminate an unsuccessful freeze attempt (e.g., slow rate of freeze and/or failure to achieve acute PVI in less than 60 secs), and instead, optioning to re-establish a better occlusion and initiate a new freeze application.
There are several limitations with this current study. The number of subjects examined in this study is small, and hence, some of the statistical test that were near statistical significance could be been significant in a larger study cohort, including: the possibility of the NSR cohort having a colder freeze temperature at 30 secs into the ablation [Table 2] and the nadir ETCO2 measurement being lower in the NSR cohort [Table 3]. While baseline patient characteristics, cardiovascular anatomies, and intraprocedural characteristics were not statistically different between the NSR and rAF cohorts, the small total population size did not allow for a statistically meaningful test of multivariable interactions. Specifically, having only five subjects in the recurrent AF cohort did not allow for robust multivariate analyses. Importantly, aAt the time of study initiation (June 2013), the literature reporting of time-to-acute PVI and other parameters of long-term success were not readily published,[4,12] 4,12 and thus, these useful parameters were not recorded in our study. Consequently, we were not able to evaluate a model of long-term efficacy parameters (e.g., time-to-acute PVI) and make statistical associations that would have included measurements of ETCO2. Indeed, any statistical analysismodeling would have been hampered by our small population in the current study. Lastly, this is a single-center experiment following the cryoablation results from an experienced single-operator. A larger multicenter study is needed before definitive statements can be made about the effectiveness of measuring ETCO2 with regards to long-term efficacy.
Before a cryoballoon freeze application, the most important parameter of success is robust balloon-to-PV occlusion. The capnogram reporting of balloon-to-PV occlusion can be obtained by measuring ETCO2, and a large change in ETCO2 has been shown to improve long-term freedom from arrhythmia at 1-year follow-up.
Dr. Pickett, Ms. Owens, and Ms. Landis report no conflict of interest. Mr. Sara and Dr. Lim are employees of Medtronic.