Immediate And Long Term Effects Of Percutaneous Mitral Balloon Valvuloplasty On Atrial Conduction Velocities In Patients With Mitral Stenosis
Hicaz Zencirkiran Agus 1, Serkan Kahraman 1, Begum Uygur 1, Arda Guler 1, Gokhan Demirci 1, Ali Kemal Kalkan 1, Mehmet Erturk 1, Mustafa Yildiz1
1
Istanbul Sağlık Bilimleri Univercity Mehmet Akif Ersoy Cardiology and Cardiovascular Surgery Institute, İstanbul.
P-wave dispersion (PWD) is an electrocardiographic (ECG) marker of nonuniform and heterogeneous atrial conduction with ECG leads of different orientation. The aim of our study was to investigate the immediate and long term effects of successful percutaneous mitral balloon valvuloplasty (PMBV) on PWD in severe rheumatic MS patients and to analyse the restenosis, atrial fibrillation (AF) and redo balloon valvuloplasty rate.
We enrolled 41 consecutive MS patients with sinus rhythm who underwent PMBV. A 12-lead ECG and transthoracic echocardiography were performed for each patient one day before, within 72 hours after the procedure and followed up by clinical visit at a mean of 5,57±1,46 (3-8) year.The mean patient age was 44.1±10.86 years.
Pmax 1(pre PMBV) and PWD 1(pre PMBV) decreased 1-3 days after PMBV. MVA improved immediately after the procedure; but lately the mean MVA decreased significantly indicating the initiation of restenosis. Composite endpoints were associated with LA 1 (p = 0.02), MVA 2 (1-3 days after PMBV) (p= 0.019), mean gradient 2 (p= 0.028), PWD 3 (3 years after PMBV) (p < 0.001) and Pmax 3 (3 years after PMBV) (<0,001). AF incidence was associated with PWD 2 (p=0,019) and PWD 3 (p=0,010). There was 14 composite endpoint on follow up and at multivariate analysis PWD 3 was identified as an independent predictor of the composite endpoint (p=0.048, hazard ratio=1.36, 95% confidence interval (CI): 1,002−1.867).
This study has demonstrated that Pmax and PWD significantly decreased within 3 days after PMBV. Furthermore, long term PWD was associated with AF and identified as an independent predictor of the composite endpoint.
Key Words : Percutaneous mitral balloon valvuloplasty, mitral stenosis, P wave dispersion.
Correspondence to: Hicaz Zencirkiran Agus
İstasyon Mah.Turgut Özal Bulvarı No:11 Küçükçekmece- İSTANBUL
İstanbul Mehmet Akif Ersoy Eğt. Araşt. Hast., Kardiyoloji Kliniği, İstanbul
Rheumatic mitral stenosis (MS) is frequently seen in developing countries and causes significant morbidity and mortality [1]. Percutaneous mitral balloon valvuloplasty (PMBV) has become an effective and safe procedure for symptomatic or hemodynamically significant MS with favorable valve anatomy [2]. This procedure is highly successful with a low complication rate and significant short and long term improvement in hemodynamics and symptoms [3,4]. P wave dispersion (PWD) is an electrocardiographic (ECG) marker of nonuniform and heterogeneous atrial conduction with ECG leads of different orientation [5]. It can be defined as the difference between maximum and minimum P wave duration. Previous investigations have shown that Pmax and PWD are increased in patients with rheumatic MS and decreased with PMBV [5,6]. In addition the prolongation of intraatrial and interatrial conduction time and the inhomogeneous propagation of sinus impulses are well known electrophysiologic characteristics of the atrium prone to fibrillate. Prolonged P-wave duration and increased PWD have been reported to carry an increased risk for atrial fibrillation (AF) [5]. Therefore, we aimed to investigate the immediate and long term effects of successful PMBV on PWD in severe rheumatic MS patients with sinus rhythm (SR) and to analyse the restenosis, AF and redoballoon valvuloplasty rate.
Seventy one patients who were in sinus rhythm were initially recruited in this study. Patients who had intraventricular conduction defect (n=2), developed AF within three years of the study (n=11) and patients lost to follow-up (n= 17) were excluded from the study. Therefore, we enrolled 41 consecutive patients with MS in sinus rhythm who underwent PMBV in our institution between 2009 and 2012. Of these patients, we analyzed those who had regular follow up visits. The mean follow up period was 5,57±1,46 (3-8) years. Because having AF at 3rd year for four patients, we examined ECG at 3rd year for all patients and continued to follow up clinically and echocardiographicly. We wanted to demonstrate our long term observation; so who developed AF within 3 years excluded. Furthermore we showed the effect of differentiation in PWD to AF and composite endpoint in long term (mean duration of 5,57 years), for patients who were in normal sinus rhythm during first 3 years.
A 12-lead ECG at 25 mm/s (paper speed) and transthoracic echocardiography using Vivid S5 with the GE 3S-RS Probe were performed for each patient one day before and within 72 hours after the procedure. They also underwent transesophageal echocardiography (TEE) 1 day before the procedure in order to rule out left atrium or appendage thrombosis. Evaluations included mitral valve area (using planimetry or the Doppler pressure half-time method), mitral gradient, echocardiographic score, mitral regurgitation (MR), tricuspid regurgitation (TR), pulmonary artery pressure. Mitral valve anatomy was scored according to the Wilkins echo scoring system [7]. The indications for PMBV were; symptomatic patients with moderate or severe MS with favorable valve morphology; symptomatic patients with unfavorable valve morphology but at high risk for surgery and asymptomatic patients with high thromboembolic risk and haemodynamic decompensation. Procedural success was defined as MVA >1.5 cm2 without severe mitral regurgitation. Exclusion criteria were having a significant valve disease other than secondary tricuspid regurgitation, left ventricular hypertrophy , left ventricular disfunction, coronary heart disease, atrial fibrillation, bundle branch block or evidence of any other intraventricular conduction defect, previous pacemaker implantation, electrolyte abnormalities, hyperthyroidism, hypertension, diabetes mellitus, taking any chronotropic medication such as digoxin.
Comprehensive 2-dimensional transthoracic echocardiograhy (TTE) was performed using Vivid S5 in all patients before PMBV, within 72 hours and at follow up visits. All patients were examined in the left lateral and supine position by precordial M-mode, 2-dimensional, Doppler, and Doppler tissue echocardiography. Left ventricle (LV) enddiastolic and endsystolic diameters, and endsystolic left atrial (LA) diameter were measured from M-mode in the parasternal long-axis views according to the standards of the American Society of Echocardiography. The mitral valve area (MVA) was measured by direct planimetry of the mitral orifice in a 2-dimensional short axis view early in diastole and also by the pressure half-time method. Continous wave Doppler was used to calculate the mitral gradient and the peak pressure gradient of TR by using the Bernoulli equation. Color flow Doppler was used to detect the presence of mitral regurgitation.
A 12-lead electrocardiogram was recorded for each patient 1 day before PMBV, on the first day after successful PMBV and at third year at a rate of 25 mm/s in a supine position. P- wave durations were measured manually by two investigators blinded to the clinical details of the patient, using digital calipers and magnifying lens (fivefold magnification) to define the electrocardiographic deflections. Intra- and interobserver coefficients of variation were found to be 3% and 4% for PWD. P-wave duration was measured from the onset to the offset of the P wave. The longest P-wave duration measured on any of the 12 ECG leads was defined as the P maximum (Pmax) and the shortest P-wave duration on any lead was defined as the P minimum (Pmin). The difference between Pmax and Pmin was calculated and defined as P-wave dispersion (PWD).
PERCUTANEOUS MITRAL BALLOON VALVULOPLASTY
The procedure was performed by experienced interventional cardiologists. PMBV was performed via the transvenous (antegrade) approach through the femoral vein using a transseptal Brockenbrough needle, following the technique described by Inoue et al. [8]. Initial balloon size was selected according to body surface area. Maximum balloon size was determined by the following formula: (Patient’s height (cm)/10) + 10. Procedural success was defined as MVA >1.5 cm2 without severe mitral regurgitation (MR) ( ≤ 2/4 MR) in the absence of in-hospital major adverse cardiac and cerebrovascular events, including any death, stroke, mitral surgery and cardiac tamponade.
Demographic, clinical, and procedural variables were collected. All patients were followed up for 5,57±1,46 (3-8) years after the index PMBV. Restenosis was defined as MVA <1.5 cm2 from follow up TTE. Composite endpoints included AF, restenosis, redoballoon, mitral valve surgery
Statistical analysis was made using the computer software Statistical Package for Social Sciences (IBM SPSS Statistics for Windows, version 21.0. released 2012, IBM Corp., Armonk, New York, USA) and data were expressed as “mean (standard deviation; SD)” for variables with normal distribution, “n (%)” for categorical variables and “median (minimum- maximum)” for variables with abnormal distribution. Fisher’s exact test and Pearson chi- square analysis performed for categorical variables. Fitness to normal distribution was analyzed with the shapiro wilk test. Mann-Whitney U test was used for comparing quantitative variables with abnormal distribution while Student t-test was used for comparing the means between two groups with normal distribution. Spearman and Pearson correlation tests were performed for correlations between ordinal variables or continuous variables with normal or abnormal distribution. Friedman’s 2-way ANOVA test was used to analyze related samples with abnormal distribution while Greenhouse Geisser test was used to analyze related samples with normal distribution. A p-value < 0.05 was considered statistically significant. Receiver operating characteristic (ROC) curve was used to compare the prognostic ability of the PWD to predict the rates of major advers cardiac events.
In this study, we enrolled 41 patients. The mean patient age was 44.1±10,86 years and 95% (n:39) of the patients were female. The median Wilkins echo score in all patients was 8 (range: 6-12). All patients’ mitral regurgitation grade was <2/4. Baseline characteristics were shown in [Table 1]. All patients underwent successful PMBV. We grouped patients as 1 (prePMBV), 2 (1-3 days after PMBV), 3 (long term after PMBV) according to the time of PMBV. All patients had normal LV systolic function. There were no significant differences with respect to left ventricle enddiastolic (LVEDD) and endsystolic diameter (LVESD), left ventricle ejection fraction (LVEF) and Pmin between three groups. Statistically significant improvement in LA diameter, MVA, PAPs, max mitral gradient, mean mitral gradient, Pmax and PWD were achieved in all patients (p<0.001), ([Table 1]). A comparison of changes in electrocardiographic and echocardiographic parameters between three groups are displayed in [Table 1]. Mean pre-PMBV MVA (MVA 1) was 1.07±0.19 cm2 and significantly improved to 1,91±0,35 cm2 after PMBV (MVA 2) (p<0.001). At long term the mean MVA (MVA 3) was significantly decreased to 1,63±0,40 (p<0,001). Mean pre-PMBV mean gradient was 14,51±6,22mmHg, which significantly decreased to 5,76±3,04 mmHg (p<0,001) within 72 hours after PMBV. At long term the mean gradient significantly increased to 7,29±3,92 mmHg (p=0,004). Median PAPs 1 was 45 (30-120) mmHg and significantly decreased to 35 (25-120) mmHg (p:<0,001) ; at long term the mean PAPs was 35 (20-115) mmHg indicating nonsignificantly difference (p=1,0). The median LA 1, LA 2, LA 3 diameter was 44 (34-69), 42(33-54),42 (33-54) cm (p<0,001,p<0,001,p=0,673).
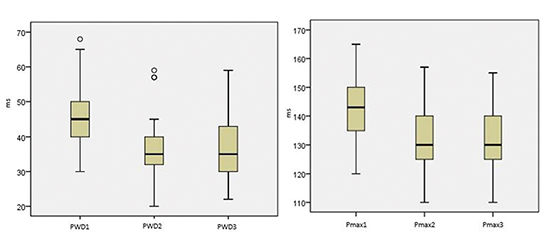
Pmax 1 and PWD 1 decreased 1-3 days after PMBV (Pmax 2;PWD 2); (p<0,001) but the difference at 3 year was insignificant (Pmax 3; PWD 3) (p=1,0 for Pmax; p=0,961 for PWD) ([Figure 1],[Table 1]). Pmin didn’t differ between groups (p=0,092). Median PWD 1 was 45 (30-68 ms, PWD 2 was 35 (20-59) ms indicating significantly difference (p<0,001).
Table 1. Baseline and after PMBV clinical, electrocardiographic and echocardiographic characteristics of patients
|
pre-PMBV |
1-3 days after PMBV |
long term after PMBV |
p |
| Age (years) |
44,1±10,86 |
- |
- |
- |
| Echo score |
8 (6-12) |
- |
- |
- |
| Gender (F/M) |
39/2 |
- |
- |
- |
| MVA |
1,07±0,19 |
1,91±0,35 |
1,63±0,40 |
<0,001 |
| Max grad |
23±8,6 |
12±5,54 |
15,1±6,02 |
<0,001 |
| Mean grad |
14,51±6,22 |
5,76±3,04 |
7,29±3,92 |
<0,001 |
| PAPs |
45 (30-120) |
35 (25-120) |
35 (20-115) |
<0,001 |
| LA diameter (cm) |
44 (34-69) |
42 (33-54) |
42 (33-50) |
<0,001 |
| LVESD (cm) |
28 (19-37) |
29 (21-39) |
30 (15-39) |
0,142 |
| LVEDD (cm) |
46 (38-52) |
47 (33-55) |
48 (32-53) |
0,058 |
| LVEF (%) |
65 (55-65) |
65 (50-65) |
60 (50-65) |
0,131 |
| P-max (ms) |
143 (120-165) |
130 (110-157) |
130 (110-155) |
<0,001 |
| P-min (ms) |
100 (75-115) |
95 (75-115) |
95 (80-111) |
0,092 |
| PWD (ms) |
45 (30-68) |
35 (20-59) |
35 (22-59) |
<0,001 |
Figure 1 Box-plot representations for PWD and Pmax between three groups. PWD 1/Pmax 1:pre PMBV, PWD 2/Pmax 2:1-3 days after PMBV, PWD 3/Pmax 3:3 years after PMBV.
In correlation analysis, negative correlation was detected between MVA 1 and PWD 1 (r=-0.097, p=0.047). PWD 2 was positively correlated with echo score , PAPs 1, LA 1 and LA 2. Furthermore, PWD 3 was also correlated with LA 1, LA 3, PAPs 3, MVA 3 positively.
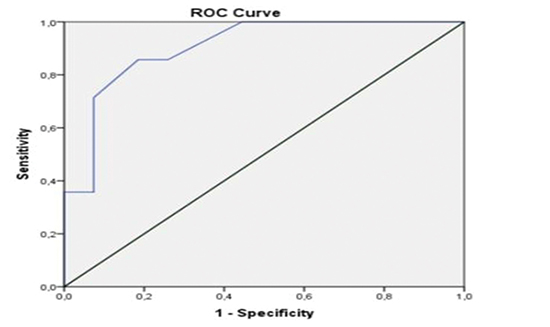
In long term follow up; 4 AF, 12 restenosis occurred and 2 patients underwent mitral valve replacement with mechanical prosthesis, 3 patients underwent redoballoon. We therefore analyzed patients, who had composite endpoints (atrial fibrillation, restenosis, redoballoon, mitral valve surgery). Fourteen composite endpoints were seen. Restenosis occured at an average of 3,92±2,15 year. Composite endpoint was associated with LA 1 (p = 0.02), MVA 2 (p= 0.019), mean gradient 2 (p= 0.028), PWD 3 (p < 0.001) and Pmax 3(<0,001) ([Table 2], [Figure 2]). Additionally the incidence of the AF endpoint was associated with PWD 2 (p=0,019) and PWD 3 (p=0,010). By receiver operating characteristic (ROC) curve analysis, increased PWD was significantly associated with adverse cardiac events (area under ROC curve [AUC]:0,905, %95 confidence interval [CI]:0,813-0,996). The best cut-off value was defined as 39 ms for MACE (Accuracy = 90.5%, sensitivity = 85,7%, specificity = 81,5%) ([Figure 3]).
Table 2. Comparison of clinical and echocardiographic paremeters of patients with and without composite endpoint
|
|
composite endpoint - n:27 |
composite endpoint + n:14 |
p |
| Age |
|
44±12 |
44±10 |
0,202 |
| Echo score |
|
8 (6-12) |
9 (6-10) |
0,376 |
| Pmax |
|
|
|
|
|
Pmax 1 |
141±11 |
146±13 |
0,202 |
|
Pmax 2 |
129,3±10 |
135,6±14,3 |
0,104 |
|
Pmax 3 |
126,4±9,8 |
142,4±7,7 |
<0,001 |
| PWD |
|
|
|
|
|
PWD 1 |
45±7 |
46±10 |
0,578 |
|
PWD 2 |
35(20-45) |
40 (27-59) |
0,081 |
|
PWD 3 |
33±7,2 |
46,1±7,8 |
<0,001 |
| MVA |
|
|
|
|
|
MVA 1 |
1±0 |
1±0 |
0,968 |
|
MVA 2 |
2 (2-3) |
2 (2-2) |
0,019 |
| Max grad |
|
|
|
|
|
max grad 1 |
24 (12-46) |
22 (8-34) |
0,379 |
|
max grad 2 |
11 (5-24) |
13 (7-32) |
0,194 |
| Mean grad |
|
|
|
|
|
mean grad 1 |
15±7 |
14±5 |
0,788 |
|
mean grad 2 |
5 (2-13) |
5 (4-18) |
0,028 |
| PAPs |
|
|
|
|
|
PAPs 1 |
45 (30-110) |
53 (35-120) |
0,406 |
|
PAPs 2 |
35 (25-62) |
35 (30-120) |
0,577 |
| LA |
|
|
|
|
|
LA 1 |
44 (34-69) |
47 (37-62) |
0,020 |
|
LA 2 |
42±5 |
42±2 |
0,568 |
Figure 2 Box plot of ECG parameters comparing MACE – and MACE +.
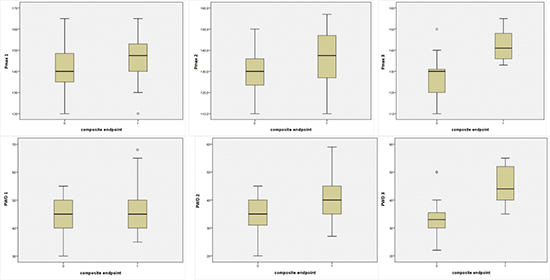
Figure 3 ROC curve analysis for PWD. To determine the best cut-off value that discriminated between MACE+ and MACE-. The cut-off was defined as 39 ms [Accuracy = 90.5%, sensitivity = 85,7%, specificity = 81,5%]
This study has demonstrated that PWD 2 and PWD 3 were associated with AF and PWD 3 was an independent predictor of long term event. We also found that Pmax and PWD significantly decreased 1-3 days after PMBV as previously described by other studies [6,9,11]. Three years later median Pmax and PWD didn’t change. MVA improved immediately after the procedure but later the mean MVA decreased significantly indicating the initiation of restenosis. The constancy of PWD lately, can be explained by the onset of restenosis. Greater ECG changes are achieved acutely and persist in the long term. However, patients with detoriated ECG parameters were interpreted as composite endpoint precursors in long term.
We found that PWD 1 was negatively correlated with MVA 1 and also PWD 3 was correlated with age, MVA 3, LA 1 and LA 3. These findings suggest that increasing mitral stenosis and larger LA volume are associated with more severe structural changes in the left atrium, leading to greater electrical inhomogeneity, non-uniform conduction velocities within the atrial myocardium, which manifests on the ECG as increased P-wave dispersion. So if PWD is longer than before, we can think about small MVA, larger left atrium requiring therapy.
Rheumatic MS still remains a major health problem in developing countries. A common arrhythmic complication encountered in patients with MS is AF. Indicators of electromechanical heterogeneity along the atria reflect the pathological changes within the atrium and also indicate an increased risk for AF development [10]. For patients with MS, disorganization of the atrial muscle bundles may be present. Structural changes in LA due to MS cause inhomogeneous electrical properties, abnormal conduction velocities and local dispersion of refractoriness within the atrial myocardium. This electrophysiological characteristic results in increased PWD and Pmax on electrocardiographic measurements. It has been reported that patients with rheumatic MS have increased PWD compared with control subjects [11-13]. Demirkan et al. [6] have shown in a study including 30 patients who were eligible for PMBV, that there was statistically significant decrease in atrial electromechanical delay (AEMD) with P-max and PWD in the early period after PMBV (in 72 h). In another study, it was shown that only successful PMBV was associated with a decrease in Pmax and PWD [14]. Similar to our results; successful PMBV procedure results in a decrease in PWD. The decline of PWD immediately after PMBV was not supported by Beig et al [15]; they found statistically significant decrease in inter and intraatrial electromechanical delays. Prolongation of P-wave duration and increased PWD were correlated with increased AF risk according to previous studies [5,16]. The correlation between the presence of intraatrial conduction abnormalities and the induction of paroxysmal AF have been well documented [17]. All these findings suggest that mechanical dilation of the mitral valve with a balloon also reduces susceptibility to AF even in the early period [18]. In our study finding an association between AF and PWD 2 / PWD3 support these results.
Our study is the first study that has long term follow-up for PWD in patients with MS. Consistent with previous studies, we documented a significant decrease in P-max and PWD after successful PMBV. The supplementary finding of this study is that after PMBV, late term PWD was associated with AF and identified as an independent predictor of the composite endpoint. By ROC curve analysis, increased PWD was significantly associated with major advers cardiac events. The 39 ms PWD cut-off level was of significant diagnostic value for MACE by the ROC curve analyses ([Figure 3]). In the light of these information, following MS patients with atrial conduction properties can be useful for restenosis and AF prediction. Further prospective randomized studies are required to confirm our results.
The main limitation of our study was relatively a small sample size. We were obliged to get ECG at 3rd year because of having patients with AF at that year.Therefore long-term follow up was not possible electrocardiographicly. Additionally, we measured the conduction times only with ECG and did not use electrophysiological study which is the gold standard method, to validate our results. Further prospective studies should be carried out to clarify the relationship between atrial conduction properties and the incidence of AF and restenosis.
All the authors declare no conflict of interest.
This study has demonstrated that Pmax and PWD significantly decreased within three days after PMBV, furthermore, late term PWD was associated with AF and identified as an independent predictor of the composite endpoint. Patients without any decrease in Pmax and PWD long term after PMBV may potentially be at greater risk for atrial fibrillation and restenosis. By electrocardiographicly P wave indices, immediate and long term effects of PMBV on relieving mitral valve obstruction can be reflected and also AF and restenosis can be predicted.