Thermal Field in Cryoablation Procedures for Pulmonary Veins Isolation: Importance of Esophageal Temperature Monitoring

Antonio Fasano1,2, Luca Anfuso2, Giuseppe Arena3, Claudio Pandozi4

1Dept. of Mathematics and Informatics U. Dini, Univ. of Florence, Italy, Associated to IASI_CNR, Rome, Italy.2FIAB, Florence, Italy.3Coronary Unit, Apuane Hospital, Massa, Italy.4Cardiovascular Department, San Filippo Neri Hospital, Rome, Italy.

Abstract

Background

Cryoablation procedures for pulmonary veins isolation have proved to be a successful treatment of atrial fibrillation, but exposure of surrounding organs to excessively low temperatures is potentially dangerous. Hence the importance of monitoring esophageal temperature and at the same time predicting the thermal field induced by the procedure, so to provide clinicians with a valuable tool to take critical decisions.

Methods and Results

We formulate a mathematical model for computing the temperature in the relevant region and we use numerical simulations to interpret recorded clinical data. The temperature at the outer esophageal surface can be much lower than the luminal one. Observing the esophageal lumen cooling rate at the early stage of the procedure it is possible to forecast whether temperature is bound to reach dangerous values; the same quantity has a correlation with the steepness of the transesophageal thermal gradient.

Conclusion

Monitoring the time evolution of luminal esophageal temperature is of fundamental importance not only to realize but also to predict well in advance critical developments of the procedure.

Key Words : cryo-ablation, pulmonary veins isolation, atrial fibrillation, esophageal lesion, esophageal temperature monitoring, thermal field computation.

Correspondence to: Claudio Pandozi, MD Cardiovascular Department, San Filippo Neri Hospital, Rome, Italy

Introduction

Atrial fibrillation (AF) is the most common arrhythmia in the Western countries and is associated with an increased mortality compared to people in sinus rhythm. Catheter ablation is an established treatment to achieve and maintain sinus rhythm in patients with recurrent AF. Pulmonary vein isolation (PVI) is the cornerstone of any ablation procedure and may be achieved with different energy sources, but radiofrequency and cryoenergy are those more widely used. Both techniques are aimed at producing lesions at PV ostia or antra to achieve the disconnection of the veins from the rest of the left atrium [1],[2],[3].

Several studies have shown that radiofrequency ablation (RFA) and cryoablation (CA) have comparable results in terms of efficacy and safety [4], [5], [6], [7], [8]. FIRE and ICE is the most recent randomized trial comparing the efficacy of the two treatments [9].

Here we refer specifically to ablations performed by means of a cryoballoon. Till recently CA was claimed to be safer than RFA concerning ETL occurrence, but then cases of fistulae have been reported with increasing frequency [10],[11],[12],[13]. Such complications have been described in many experimental studies revealing an extreme variability of patients' reaction [14],[15],[16],[17],[18],[19],[20],[21],[22],[23].

ETLs are most likely to occur when the patient's esophagus is particularly close to the posterior atrial wall (Sánchez-Quintana [24] presents helpful anatomical studies). Theoretical mathematical models for atrial RF ablation have been formulated and implemented [25],[26].

The main scope of the present paper is to formulate a mathematical model for CA, which allows computing the whole thermal field in the relevant region. We validate the outcome of numerical simulations on the basis of experimental data, pointing out some important facts concerning the necessity of monitoring Luminal Esophageal Temperature (LET).

Based on numerical simulations we infer some criteria for the correct interpretation of LET measurements, emphasizing the role played by the thermal gradient and by the cooling rate detected at the early stage of the procedure. The importance of the latter quantity has been recently emphasized by Deiss et al [27].

Methods

Mathematical model

Let us introduce the model geometrical setting. Critical geometrical parameters affecting the thermal field during CA are the esophagus thickness, its distance from the left atrium, and the epicardial fat layer (EFL) thickness. These parameters may vary considerably. Therefore, a mathematical model can only refer to an average situation. Of course, the model can be adapted to specific cases when information on the actual location of the relevant organs is available.

Nevertheless, since the thermal diffusivity of the involved tissues is within a rather narrow range, even computing the thermal field for a standard case may give a significant hint of what we can expect when e.g. the esophagus happens to be closer to the heart.

Since we are facing a great anatomical diversity, it makes sense to select a simplified geometry (a strategy also adopted by Berjano [25], Berjano and Hornero [26]), capturing the thermal field in the region of interest with reasonable approximation. The esophagus is represented by a straight cylinder E, whose lumen is in close contact to the probe, in consideration of the fact that it presents a constriction in correspondence of the LA (nice pictures can be found at https://www.med-ed.virginia.edu/courses/rad/gi/esophagus/anat01.html).

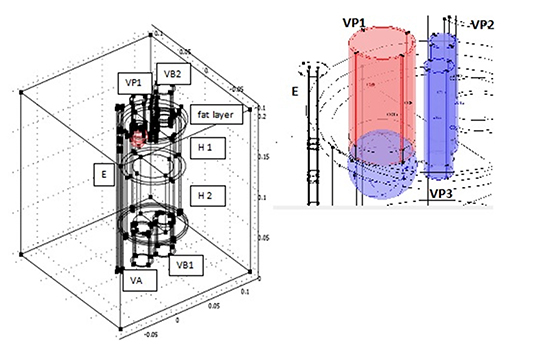
The heart is an immobile cylinder H [Figure 1], surrounded by a fat layer and separated in two halves by a septum of negligible thickness parallel to the blood flow, impervious to blood and pervious to heat [Figure 1]. Heart pulsations can be averaged out during the time of one application (equivalent to two of three hundreds heartbeats) so that blood flow can be taken stationary. Each half of the cylinder H has two chambers H1 (atria) and H2 (ventricles) having different thickness. We further simplify geometry, with no substantial alteration of the thermal field, considering a scheme in which two PVs merge (namely those that are going to be occluded by the cryo-balloon). Thus, we sketch blood supply to the left atrium by means of three vessels: one large, VP1, two small, VP2, VP3. We put VP1 as close as possible to the cylinder E in order to maximize esophageal exposure to the cryo source. How to sketch blood outflow and inflow in other chambers is immaterial from the point of view of the thermal behavior, so in our geometrical scheme we put just one duct VA leaving the left ventricle and two (VB1, VB2) assuring blood flow through the right chambers. A flat velocity profile determined by the imposed discharge is assumed at each cross section to avoid the unnecessary complexity of fluid dynamics.

Figure 1. Sketch of the geometrical setting (left) and detail of the balloon region (right).


The idealized elements described so far are placed in a cubic box, whose side is 20 cm long. The initial temperature is assumed to be 37°C everywhere, as well as the temperature TB of the blood perfusing the organs.

Of course, this setting is quite sketchy, but it captures the basic elements, as far as thermal conduction is concerned.

We considered two sets of geometrical parameters representing non-exceptional anatomical structures, but combined in such a way to imply rather different thermal behaviors. Clearly, the presence of much thicker EFL, like in obese patients, would act as a very effective thermal shield for the esophagus. Among the papers consulted to choose the anatomical data, we quote Xia [28] and Bertaso [29],

SET 1 (largely safe conditions): esophagus thickness 3mm, EFL thickness 3mm, esophagus-balloon surface distance 1.10 cm;

SET 2 (border to critical): esophagus thickness 2.5mm, EFL thickness 1mm, esophagus-balloon surface distance 0.65cm.

Let us now sketch the equations governing heat transport. For the blood flowing through H, transport is due to diffusion and convection:

Equation 1


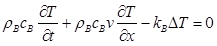
(see [Table 1] for density ρB, specific heat cB, and thermal conductivity kB ), where Δ is the Laplace operator and v is blood velocity, supposed uniform over cross sections). In the composite domain esophagus + connective + heart + EFL we use Pennes equation, also known as the bioheat equation

Equation 2


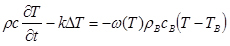
where ρ, c, k take the corresponding value listed in [Table 1] (from Berjano [25] and Berjano and Hornero [30]), TB is equal to 37°C, and ω(T) is the temperature dependent blood perfusion rate, given as

Equation 3


as long as it is positive, and zero otherwise, with w0 as in [Table 1] (from Holmes [31]).

Table 1. Tissues thermal properties


Ρ          (Kg m–3)

c

(J kg–1 K–1)

k              (W m–1 K–1)

Ω 0

(s 1 )

Esophagus

1000

3700

0.4

3×10⁻³

Connective

1000

3200

0.4

6×10⁻⁴

Fat

900

2200

0.2

5.5×10⁻⁴

Heart

1200

3200

0.7

0.017

VA. VB

1000

3200

0.4

-

Blood

1000

4180

0.54

-


There is no general agreement on the value to be given to the ratio w1/w0. Following Lakhssassi [32] we take w1/w0 =1.

In equation (2) we have neglected the source term expressing the metabolic heat production, estimated to be 1÷2 W/kg at rest.

In simulations we have used a 23mm diameter balloon at uniform temperature Tc = –70°C.

Two situations have been considered:

• 5 min cooling (a time never exceeded in the procedure)

• 4 min cooling, followed by the recovery of the baseline temperature in the balloon during the next 30 sec (this kind of simulation is important to understand how some of the relevant tissues keep cooling for a while after interruption of refrigerating gas).

LET measurements

Cryo-ablation procedures were performed at the Coronary Unit at the Hospital of Massa, Italy (June-October 2015) with a cryo-balloon Arctic Front Advance (Medtronic, Inc, Minneapolis, MN, USA). LET was recorded by means of the catheter Esotherm (FIAB SpA, Vicchio, Italy) with three olive shaped stainless steel rings bearing a thermocouple and connected to the Esotest monitor (FIAB SpA, Vicchio, Italy). The probe was positioned with fluoroscopic guide into the esophagus at the level of the cryo-balloon. Data were recorded by means of a data logger. Procedures followed the standard protocols of Apuane Hospital (Massa). Data were collected from a random set of nine de-identified patients, not specifically enrolled for the present study.

Table 2. First category of recorded data (patients exhibiting safe LET evolution)

Curve

Basal temp.(°C)

Vein

LET at 240 s (°C)

MCR (°C/s)

Nadir temp. (°C)

Nadir time (s)

1*

36.1

LSPV

25.1

0.06

24.9

253

2†

35.6

RSPV

33.4

~0.01

33.4

240

3†

35.3

RIPV

32.4

~0.01

32.1

265

4‡

36.8

LIPV

35.7

< 0.01

35.7

240

5‡

36.2

LSPV

35.2

< 0.01

35.2

240

6‡

36.0

LIPV

35.4

< 0.01

35.4

240

36.5

LSPV

20.1

0.1

19.8

264

36.5

LIPV

23.0 (after 225 s)

0.08

22.6

257

35.2

RIPV

30.1

0.03

Not recorded


* LET evolution compatible with the predicted PE1 curve in [Figure 4]† Mild esophageal cooling. LET basically coincident with the PE1 curve in [Figure 3]‡ Negligible esophageal cooling§ LET behavior intermediate between the curves PE1, PE2 in [Figure 4], indicating that esophagus was at shorter distance from heart than in the theoretical case (estimated difference 1-2mm)ǁ LET behavior intermediate between the curves PE1, PE2 in [Figure 4], indicating that esophagus was at shorter distance from heart than in the theoretical case (estimated difference 1-2mm)¶ LET behaves like the PE2 curve in [Figure 3] (the estimated sensor-balloon distance is ˜3mm less than the one in SET1)

Results

I) Simulated time temperature evolution in some selected point of interest.

In [Figure 2] we illustrate the set of points which are relevant to our simulations.

First group of simulations: balloon temperature –70°C. Duration of cooling 300 sec.

Figure 2. Cross sectional view through the balloon showing points PE1 (internal esophageal wall), PE2 (external esophageal wall), M (median point between esophagus and fat), PF (fat boundary facing esophagus), PH (external atrium wall).


Concerning the geometrical parameters in SET 1, the temperature at the points shown in [Figure 2] is plotted vs. time in [Figure 3].

In the chosen geometry, computed LET (identifiable with the curve PE1) exceeds the esophageal external temperature by only 2.5°C.

Figure 3. Cooling curves, balloon temperature –70°C, duration of cooling 300 sec. The geometrical parameters are the ones of SET 1. The respective temperatures (°C) after 240 sec are: 34, 32, 29, 26, 8. PE1 max cooling rate is 0.02°C/s. PE2 max cooling rate 0.03°C/s


We observe that the transesophageal thermal gradient reached after 5 min is in this case rather moderate: 0.8°C/mm.

One more remark is about the maximal speed of temperature variation, which in PE1 is very small (0.02°C/s), as well as in PE2(0.03°C/s), in comparison with the much larger one in PH(0.5°C/s). However, if the esophagus runs closer to the heart the LET variation will be definitely faster. Actually, there is a clear correlation between the LET descent rate at the early stage and its expected evolution later. Such a feature is confirmed by the simulation run for the parameters in SET 2 [Figure 4], which emphasizes the great influence of the reduction of the fat layer thickness and of the esophagus-balloon distance.

Numerical results show that SET 2 is border to critical concerning the external esophageal wall. Much smaller LET values, even below zero (down to an astonishing −12°C reported by Fürnkranz[16]), can be reached in the clinical practice if conditions are particularly unfavorable. In [Figure 4] we may notice the remarkable fact that while LET stays in a non-alarming range (terminal value 26°C), the external esophageal temperature drops to 10°C (the transesophageal thermal gradient is now 6.4°C/mm). The maximal cooling rate of the external esophageal wall is 0.22°C/s, and we find a much larger value when approaching the fat layer (0.65°C/s).

Figure 4. Cooling curves, balloon temperature –70°C, duration of cooling 300 sec. The geometrical parameters are the ones of SET 2. The respective temperatures after 240 sec are 28, 12, 7, -2, -20. PE1 max cooling rate: 0.06°C/s. PE2 max cooling rate: 0.22°C/s.


Second group of simulations: balloon temperature –70°C, duration of cooling 240 sec followed by the return of the balloon temperature to 37°C in 30 sec.

We report simulations for the parameters in SET 1 only. [Figure 5] emphasizes that LET, that equals 34°C at time 240 s, is not yet increasing 160 s after the suspension of gas supply. Likewise, temperature in PE2 decreases by one more degree. This is in agreement with the observation of Fürnkranz [20], where a decrease of 1.5°-2°C was found after interruption. For the parameters in SET 2 nadir temperature is expected to be ˜3°C lower than the one at time 240 s (based on experimental observation).

Figure 5. Cooling at -70°C for 240 sec. Then return of the balloon temperature to 37°C in 30 sec. Temperature of distal organs keep decreasing for several seconds. Parameters as in SET 1


On the contrary, temperature in PH reacts almost immediately to reheating owing to the proximity to the balloon.

II) Measured temperature profiles during cryo-ablation procedures

The figures below show some representative LET-vs time curves related to 13 PVIs performed on nine patients. All the 36 PVI procedures were successful, but we chose to omit the ones showing negligible temperature variations. For a better reading of the data, we just plotted the temperature of the coldest of the three sensors on the probe. We group the curves in two categories: 9 in which LET stays in a safe range [Figure 6] during the standard cooling time (240s), and 4 that have been interrupted earlier because LET had attained abnormally low values [Figure 7], where dots indicate the switch off time). The remaining 23 data not plotted were in category 1. Three of the nine patients were subjected to marked esophageal cooling. Particularly important data are reported in [Table 2] and [Table 3] according to their category (L = Left, R = Right, S = Superior, I = Inferior, MCR = Max Cooling Rate).

Table 3. Second category of recorded data (patients with risky LET evolution)

Curve

Basal temp.(°C)

vein

LET at switch off (°C)

Switch off time (s)

MCR (°C/s)

Nadir temp. (°C)

Nadir time (s)

10*

36.0

LSPV

19.5

110

0.24

16.5

135

11†

35.6

LIPV

15.3

105

0.31

12.5

129

12‡

35.5

LSPV

20.0

160

0.18

15.8

210

13§

35.4

LIPV

18.5

140

0.18

17.1

152


* LET behavior intermediate between the curves PE2, PM in [Figure 4]. Alarming MCR.† LET behavior similar to PM in [Figure 4]. Dangerous MCR. External esophageal wall may have approached 0°C‡ LET behavior like PE2 in [Figure 4]§ LET behavior like PE2 in [Figure 4]

Figure 6. LET time course in 9 procedures exhibiting a normal behavior.


Figure 7. LET time course in 4 procedure with fast cooling and consequent early interruption.


Discussion

Model targets

Since the minimal esophageal temperature is reached at the external esophageal wall, one of the main targets in our investigation of the thermal field during CA for PVI was to evaluate the difference between the internal and external esophageal temperature. Moreover, we wanted to emphasize the relationship between LET decrease rate at the early stage of the procedure and the later onset of a steep transesophageal thermal gradient. Indeed the possibility of predicting such a gradient is a valuable help in the selection of a threshold LET preventing ETL. Such a feature has been discussed quite recently by Deiss et al [27]. Finally, the mathematical model allows evaluating the size of discrepancies that may occur between measured and actual LET.

Main findings

The model indicates that the difference between internal and external esophageal temperature turns out to be as large as 16°C in a seemingly not critical case [Figure 4]. This fact has received a confirmation in an experiment performed on dogs[33]. Clearly even larger thermal gradients are achieved when the esophagus is closer to the left atrium, incrementing the difference between the measured LET and the periesophageal temperature in a dangerous way. Despite the fact that [Figure 4] refers to a specific geometry (SET2), we can anyway use it to reasonably describe such a situation by interpolating between the curves corresponding to points PE2, PM, PF, thanks to the similarity of the thermal diffusivity of the involved tissues. For instance if the esophagus is 2.5mm closer to the atrium, LET can be read with good approximation along curve PE2 instead of PE1. In such a way, we realize that even quite a small displacement of the esophagus towards the cryo-balloon can have dramatic consequences on LET. Similarly, we can have an idea of what happens by perturbing the geometry of SET2 in other ways (thinner esophagus and/or atrium wall, reduced thickness or absence of the fat layer, etc.).

Still referring to [Figure 4], we remark that points closer to atrium also exhibit a faster initial cooling rate. Thus, we can say that, for the reasons explained above, calculating the initial slope of the LET cooling curve allows to predict dangerous situations. This looks to be a good criterion to establish whether the procedure is at risk, alerting the clinician about the possibility to abort it at an earlier stage, much before esophageal injuries can arise and still with a good chance of success. The quoted paper by Deiss et al [27] addresses such an issue with great clarity, plotting minimal measured LET vs. max cooling rate. We have reported our own results in [Figure 8] with the purpose of comparison. In [Figure 8] circles represent the clinical data of [Figure 6] (procedures completed in the standard time), triangles and stars are predictions according to simulations in [Figure 5] and [Figure 4], respectively. Concerning the latter case, the reported temperatures are obtained subtracting ˜3°C from the values attained after 240s, which is a typical decrease after switch off encountered in critical cases as suggested by the results in [Figure 7]. The agreement between our [Figure 8] and the corresponding figure of Deiss et al[27] is excellent. Based on our theoretical and clinical investigation, we realized that MCRs exceeding 0.15°C/s are associated with the possible attainment of dangerous temperatures, suggesting the consequent interruption of gas supply to the cryoballoon. This confirms the similar conclusion by Deiss et al[27] (the threshold there identified is 8.5°C/m˜0.14°C/s).

Figure 8. minimal achieved LET vs MCR.


° Experimental, deduced from [Figure 6]★ Predicted (cooling curves E1, E2, M, data as in SET2, [Figure 4]: min.temp.=temp.at 240s - 3°C)▴ Predicted (cooling curves E1, E2, M, data as in SET1, [Figure 4])

We have performed several more simulations in order to show the influence of some of the parameters (e.g. cardiac output, perfusion rate, etc.). We do not report all these results, but we want to discuss two more aspects emerging from the calculation performed in the considered geometries, regarding the real meaning to attach to the LET measure. First of all, the value detected by a thermocouple is actually the temperature at the welding point on the metallic sensor. Owing to the large thermal diffusivity of stainless steel (˜4.10-6m2/s) temperature is rather uniform throughout the metallic body, and we can assume it to be the mean temperature over the luminal cross section. However, it is legitimate to ask what the real thermal excursion is over the esophageal cross section at which the nadir temperature is attained. The answer is rather surprising: in the fairly safe conditions of SET1 it equals 3.5°C, meaning that that the detected LET may differ from the actual nadir temperature by almost 1.8°C. Another possible source of error can come from an incorrect longitudinal deployment of the probe. Still for SET1 we have calculated that if e.g. the probe misses the coldest point by 2cm the detected LET will be 2°C above the nadir. Of course, all such discrepancies widen in cases that are more critical. Thus, clinicians have to know that these errors may sum up, in an amplified way in critical cases, giving a false impression of safety.

Model validation

The LET time course during CA has not been reported frequently in the literature. The cooling curve shown in Ahmed et al[14] is in very good agreement with the LET time behavior predicted in [Figure 4] (point PE1), which is a first confirmation about the model validity. Let us now proceed with the comparison of numerical simulations with the clinical data collected at Apuane Hospital.

Some general remarks are necessary to understand the origin of possible discrepancies between theory and practice.

• The balloon temperature never reaches the theoretical value of ¯70°C, but it stabilizes to values between ¯40°C and ¯60°C, depending on the patient, possibly producing much milder LET variations.

• LET measures during the reheating stage frequently exhibit a short stasis or even a momentary temperature regression, not predicted by the model. In our opinion, this corresponds to the phase of balloon extraction, which is performed after some time, when the balloon has returned to a harmless temperature. After removal, the low temperature blood in the operated pulmonary vein resumes circulation, and the phenomenon is detected (with some delay) by the thermal sensors.

• Balloon orientation and PV morphology can have some influence on LET evolution.

. Theoretical curves must be shifted to be adapted to actual patient's baseline temperature.

In view of such considerations we may assert that in the first category (70% of cases) the all detected LET curves [Figure 7] agree with the model predictions [Figure 3]-[Figure 4] and that anyway the model allows at least to interpret abnormal cases of category 2 [Figure 8] in terms of deviations from standard geometry. The 23 data not shown are also compatible with our mathematical model, modifying data to allow e.g. a larger distance of PVs from the posterior left atrial wall.

Conclusions

We have formulated a mathematical model that is able to predict LET behavior during cryo-ablation procedures for the majority of cases. However, its main utility is that it can give some information of clinical interest in the cases exhibiting abnormal esophageal cooling. For instance, it indicates that there exists a critical threshold for MCR during the early stage of the procedure, while LET is still in a quite safe range, warning the clinicians that a dangerous situation is going to develop. Such a threshold has been identified as 0.15°C/s. By the way, we remark that excessive esophageal cooling occurred in one third of the patients, revealing that deviations from “normality” is not rare.

The model elucidates additional interesting features, emphasizing the influence of some critical physiological parameters, such as EFL, atrium and esophagus thickness. The external esophageal temperature can be much lower that LET and can reach dangerous values even if LET is far from an alarm threshold. The model has been implemented for safe or border-to-safe geometries, but it also allows interpreting critical LET evolutions due to a reduced esophagus-balloon distance, even providing an indirect measure of such a quantity. Finally, the model predictions fit remarkably well the data recorded during CA procedures performed at the Apuane Hospital (Massa, Italy), as well as those found in the literature (most notably Ahmed et al [14] and Deiss et al [27]).

Conflict Of Interests

None.

Disclosures

Antonio Fasano is R&D manager at FIAB, Italy. Luca Anfuso is researcher at FIAB, Italy.

References

  • [ PubMed ]
  • [ PubMed ]
  • [ PubMed ]
  • [ PubMed ]
  • [ PubMed ]
  • [ PubMed ]
  • [ PubMed ]
  • [ PubMed ]
  • [ PubMed ]
  • [ PubMed ]
  • [ PubMed ]
  • [ PubMed ]
  • [ PubMed ]
  • [ PubMed ]
  • [ PubMed ]
  • [ PubMed ]
  • [ PubMed ]
  • [ PubMed ]
  • [ PubMed ]
  • [ PubMed ]
  • [ PubMed ]
  • [ PubMed ]
  • [ PubMed ]
  • [ PubMed ]
  • [ PubMed ]